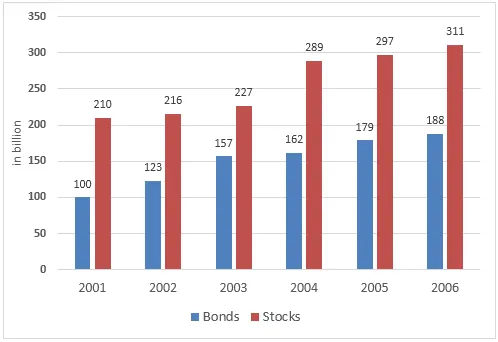
The line graph illustrates the investment trends of the inhabitants of a particular nation in the stock market over a five-year period, from 2001 to 2006.
Overall, it can be observed that the investment in the stock market experienced a fluctuating trend throughout the period. Notably, there was a significant surge in the amount of money invested in the middle years, followed by a sharp decline towards the end of the period.
In 2001, the investment started at a relatively low point, with a slight increase in 2002. However, the years 2003 and 2004 saw a dramatic rise in the amount of money invested, reaching a peak in 2004. This could possibly be attributed to favourable market conditions or increased investor confidence during these years.
Following the peak in 2004, there was a steep fall in the investment in 2005, which continued to drop in 2006, returning to near the initial level of 2001. This significant downturn in the later years might suggest a loss of investor confidence or a downturn in the market.


