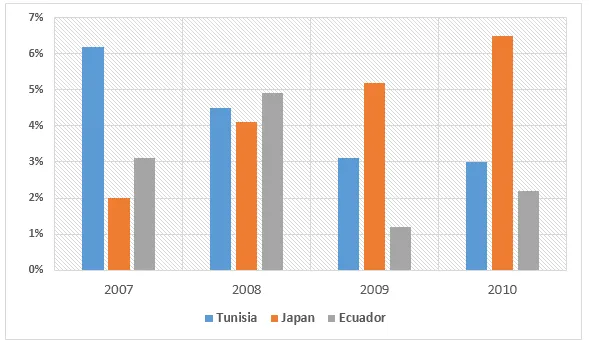
The bar chart illustrates the annual changes in GDP for three different nations, namely China, India, and the United States, over a four-year period from 2007 to 2010.
In general, all three countries experienced fluctuations in their GDP growth rates during the given time frame. However, China consistently outperformed the other two nations, while the United States saw the most significant drop in its GDP growth rate.
Looking at the specifics, China's GDP growth rate remained relatively stable, hovering around 9% to 10%, with a slight dip in 2009. India, on the other hand, saw a steady decline in its GDP growth rate, starting at 9% in 2007 and falling to 7% in 2010.
The United States experienced the most dramatic change. In 2007, the GDP growth rate was 2%, but it plummeted to -3% in 2009 due to the global financial crisis. However, a recovery was evident in 2010 when the GDP growth rate climbed back to 2%.


