IELTS HUB
Table restaurantsalesbusiness district Graph #102
Academic Writing Task 1

You should spend about 20 minutes on this task.

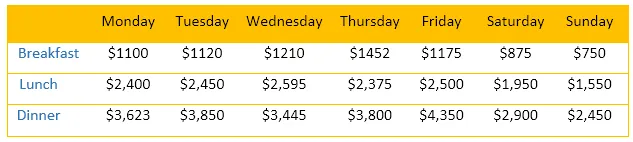
The table below shows the sales at a small restaurant in a downtown business district.

Table: Sales at small restaurant in business district

Summarise the information by selecting and reporting the main features, and make comparisons where relevant.

Write at least 150 words.

One box per paragraph, then compare with Band 9.
157 words · 4 paragraphs
Introduction

The table delineates the fluctuation in sales of a petite eatery situated in a metropolitan business area.

Overview

At a glance, it is evident that the sales experienced a significant variation over the time period. Notably, the highest sales were recorded during the lunch hours, while the lowest were observed in the late evening.

Body 1

Delving into the details, the sales during the breakfast hours were relatively stable, with a slight increase from 6 am to 9 am. The sales then spiked dramatically during the lunch hours, peaking at 1 pm with a substantial increase. This could be attributed to the influx of office workers during their lunch break.

Body 2

Following the lunch rush, the sales began to decline gradually from 2 pm onwards, reaching their lowest point at 8 pm. Despite a slight increase at 9 pm, the sales remained relatively low during the evening hours. This trend suggests that the restaurant is less popular among the late-night crowd.


Go further with the books

Academic Task 1

100 Band 9 Task 1 Samples

Real Exam Charts, Maps, and Processes

₹299$9.99CAD 13.99AUD 14.99£7.99NZD 16.99€8.99AED 39SGD 12.99

Free preview

Academic Task 1

IELTS Academic Task 1, Decoded

Graphs, Maps, and Processes Explained

₹299$9.99CAD 13.99AUD 14.99£7.99NZD 16.99€8.99AED 39SGD 12.99

Free preview

Writing Task 2

100 Essential IELTS Essays

Band 9 Sample Answers for the Real Exam

₹199$6.99CAD 8.99AUD 9.99£4.99NZD 10.99€5.99AED 24SGD 8.99

Free preview

Next question: Bar Graph #103
