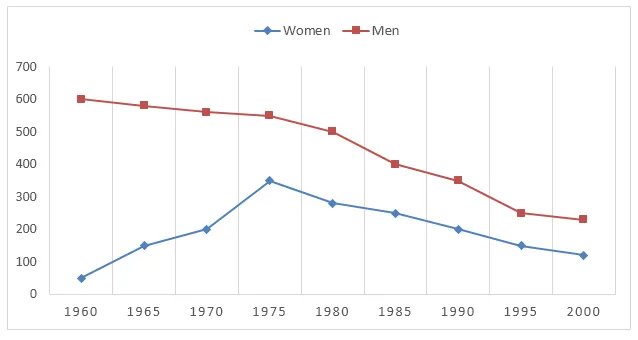
The line graph provides data on the prevalence of smoking among males and females in Bhutan over a forty-year period from 1960 to 2000.
The graph reveals a general trend of decreasing smoking rates for both genders over the given period. However, the rate of decline varied significantly between men and women.
In 1960, the percentage of male smokers was significantly higher than that of female smokers, at approximately 70% and 30% respectively. Over the next two decades, the proportion of male smokers saw a sharp decrease to around 50%, while the percentage of female smokers experienced a more gradual decline to just over 20% by 1980.
From 1980 to 2000, the rate of smoking among men continued to fall, reaching about 30% by the end of the period. In contrast, the percentage of female smokers remained relatively stable at around 20% for the same twenty years. This suggests that anti-smoking measures may have been more effective among the male population.


