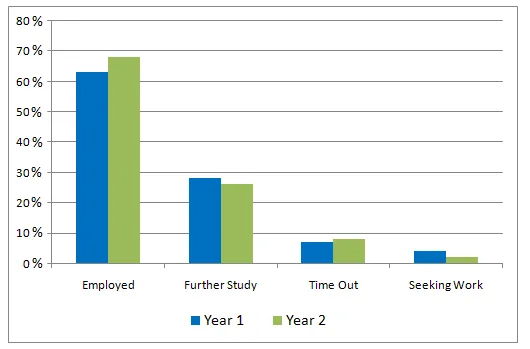
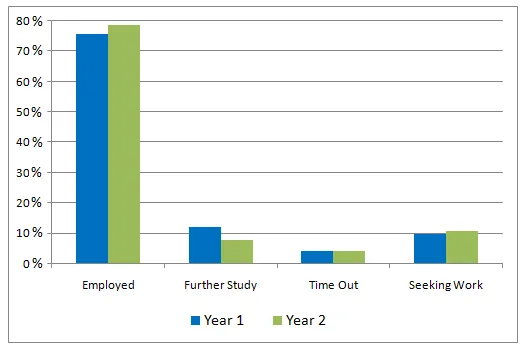
The provided diagrams illustrate the activities of business and engineering graduates from a specific university, six months post-graduation, over a span of two years.
Overall, it can be observed that the majority of both business and engineering graduates were employed, while a small fraction was either unemployed or pursuing further studies. There were also slight variations in the statistics between the two years.
In the first year, approximately 60% of business graduates were employed, which increased to around 70% in the second year. The proportion of unemployed business graduates decreased from 25% to 15% over the same period. Meanwhile, the percentage of those continuing their studies remained relatively stable at about 15%.
Regarding the engineering graduates, around 65% were employed in both years. However, there was a noticeable increase in unemployment from 20% in the first year to 25% in the second year. The percentage of those opting for further studies dipped slightly from 15% to 10%.


