IELTS HUB
Table educationsecondary schoolsattendance Graph #123
Academic Writing Task 1

You should spend about 20 minutes on this task.

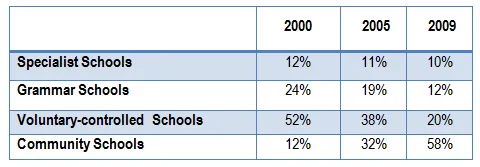
The table shows the proportions of pupils attending four secondary school types between 2000 and 2009.

Table: Secondary school attendance by type 2000-2009

Summarise the information by selecting and reporting the main features, and make comparisons where relevant.

Write at least 150 words.

One box per paragraph, then compare with Band 9.
145 words · 4 paragraphs
Introduction

The table illustrates the percentage of students attending four distinct types of secondary schools from 2000 to 2009.

Overview

It is immediately clear that the proportion of pupils in specialist schools saw a significant increase over the period, while the percentage in voluntary-controlled schools fell markedly. The figures for community and foundation schools, on the other hand, fluctuated slightly.

Body 1

In 2000, a majority of students, 58%, were enrolled in community schools, which dropped to 52% in 2009. Meanwhile, the percentage of pupils in foundation schools was 20% in 2000, which increased to 22% in 2005, then fell back to 20% in 2009.

Body 2

In contrast, the proportion of students in specialist schools was only 12% in 2000, but this figure climbed steadily to reach 28% in 2009. Conversely, the percentage of pupils attending voluntary-controlled schools declined significantly from 10% in 2000 to a mere 2% in 2009.


Go further with the books

Academic Task 1

100 Band 9 Task 1 Samples

Real Exam Charts, Maps, and Processes

₹299$9.99CAD 13.99AUD 14.99£7.99NZD 16.99€8.99AED 39SGD 12.99

Free preview

Academic Task 1

IELTS Academic Task 1, Decoded

Graphs, Maps, and Processes Explained

₹299$9.99CAD 13.99AUD 14.99£7.99NZD 16.99€8.99AED 39SGD 12.99

Free preview

Writing Task 2

100 Essential IELTS Essays

Band 9 Sample Answers for the Real Exam

₹199$6.99CAD 8.99AUD 9.99£4.99NZD 10.99€5.99AED 24SGD 8.99

Free preview

Next question: Line Graph #124
