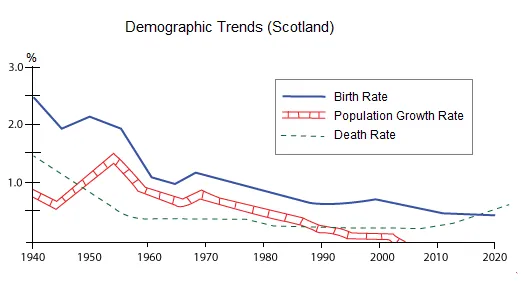
The figure provides information about the demographic patterns in Scotland from 1900 to 2000.
It is noticeable that the population of Scotland experienced an overall increase over the century, despite a few fluctuations. Additionally, the age distribution underwent a significant transformation, with the proportion of elderly people seeing a substantial rise.
In 1900, the population of Scotland stood at around 4.5 million, and it saw a steady increase until 1975, reaching approximately 5.25 million. However, the population dipped slightly to just under 5.2 million in 1985 before increasing again to reach its peak at nearly 5.3 million in 2000.
Regarding the age distribution, the percentage of people aged 65 and over was relatively low at the start of the century, at about 5%. However, this figure started to climb steadily from 1950 onwards, reaching approximately 16% by the end of the century. Conversely, the proportion of people under 15 years of age, which was initially high at around 30%, declined gradually to about 20% by 2000.


