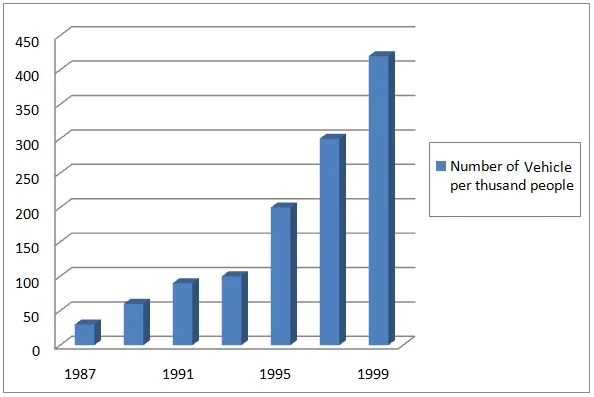
The bar graph provides data concerning the possession of vehicles in China over a period of three decades, from 1980 to 2010.
The graph reveals a significant increase in the number of privately owned vehicles during the given period, with a particularly noticeable surge in the last decade. Conversely, the number of vehicles owned by the government and companies showed a less dramatic increase.
In 1980, private vehicle ownership was virtually nonexistent, while government and company-owned vehicles numbered around 20,000 and 500,000 respectively. By 1990, private ownership began to emerge, reaching approximately 500,000, while government and company-owned vehicles increased to about 30,000 and 1 million respectively.
The period from 2000 to 2010 witnessed a remarkable growth in private vehicle ownership, soaring from 5 million to nearly 20 million. Meanwhile, government and company-owned vehicles continued to rise, reaching around 50,000 and 5 million respectively by 2010. Despite the increase, these figures were significantly overshadowed by the surge in private vehicle ownership.


