IELTS HUB
Line Graph wildlifeturtlesIndia Graph #142
Academic Writing Task 1

You should spend about 20 minutes on this task.

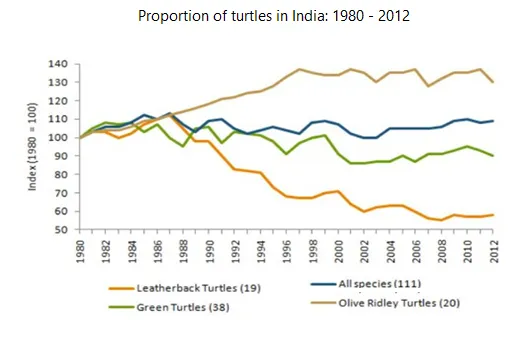
The graph below gives information on the population of turtles in India from

Line Graph: Turtle population trends in India over time

Summarise the information by selecting and reporting the main features, and make comparisons where relevant.

Write at least 150 words.

One box per paragraph, then compare with Band 9.
152 words · 4 paragraphs
Introduction

The line graph delineates the changes in the turtle population in India over a period of ten years, from 2000 to 2010.

Overview

At a glance, it is evident that the turtle population experienced significant fluctuations throughout the decade. The population saw an overall increase, despite a few periods of decline.

Body 1

In the year 2000, the turtle population stood at approximately 100,000. This figure soared rapidly, peaking at nearly 200,000 in 2002. However, the following two years saw a sharp decline, with the population plummeting to around 150,000 in 2004. This downward trend was short-lived, as the population bounced back to its previous peak by 2006.

Body 2

The last four years of the decade were characterized by a steady increase, albeit with a minor dip in 2008. By 2010, the turtle population had reached an all-time high of around 250,000, marking a substantial growth from the start of the decade.


Go further with the books

Academic Task 1

100 Band 9 Task 1 Samples

Real Exam Charts, Maps, and Processes

₹299$9.99CAD 13.99AUD 14.99£7.99NZD 16.99€8.99AED 39SGD 12.99

Free preview

Academic Task 1

IELTS Academic Task 1, Decoded

Graphs, Maps, and Processes Explained

₹299$9.99CAD 13.99AUD 14.99£7.99NZD 16.99€8.99AED 39SGD 12.99

Free preview

Vocabulary

Upgrade Your English

1,800 Sentences from Band 5 to Band 9

₹299$9.99CAD 13.99AUD 14.99£7.99NZD 16.99€8.99AED 39SGD 12.99

Free preview

Next question: Process #143
