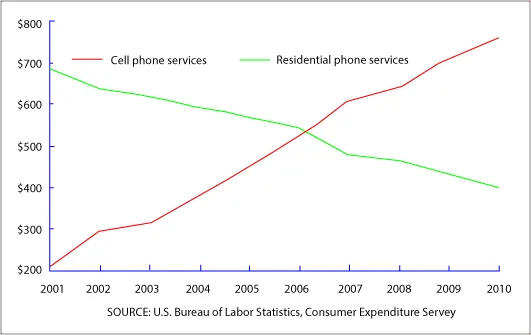
The line graph provides information about the average amount of money spent by people in the United States on mobile phone and landline services per year over a nine-year period from 2001 to 2010.
At a glance, it is evident that there was a significant change in the spending habits of US consumers on these two types of phone services during the given period. While expenditure on cell phone services saw a steady increase, the money spent on residential phone services displayed a downward trend.
In 2001, American consumers spent roughly $200 per annum on cell phone services, whereas the annual expenditure on residential phone services was approximately $700. However, over the next nine years, expenditure on cell phone services rose steadily, reaching about $750 by 2010. In contrast, spending on residential phone services started to decline from 2006 onwards, falling to just over $400 by 2010.
In conclusion, the period from 2001 to 2010 saw a marked shift in the spending patterns of US consumers, with a clear preference for cell phone services over residential phone services. This trend reflects the growing popularity and affordability of mobile phones during this period.


