IELTS HUB
Combination climateEast Africarainfall Graph #152
Academic Writing Task 1

You should spend about 20 minutes on this task.

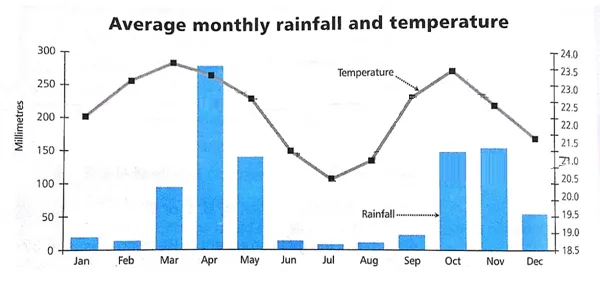
The graph and bar chart below show the average monthly rainfall and temperature for one region of East Africa.

Combination: East Africa rainfall and temperature monthly averages

Summarise the information by selecting and reporting the main features, and make comparisons where relevant.

Write at least 150 words.

One box per paragraph, then compare with Band 9.
155 words · 4 paragraphs
Introduction

The line graph and bar chart illustrate the mean monthly precipitation and temperature respectively for a certain area in East Africa.

Overview

At a glance, it is evident that rainfall and temperature patterns fluctuate throughout the year, with a peak in rainfall during April and the highest temperature in February. Conversely, the driest and coldest months are January and July respectively.

Body 1

Delving into the details, the rainfall starts to increase from January, reaching a high of approximately 200mm in April, before declining sharply to around 50mm in May. Thereafter, a second, less pronounced peak occurs in November at roughly 150mm, followed by a steep drop to nearly zero in December.

Body 2

In terms of temperature, the warmest month is February with an average of about 28 degrees Celsius. The temperature then gradually decreases to its lowest point of nearly 15 degrees in July. After July, the temperature starts to rise again, reaching approximately 25 degrees in December.


Go further with the books

Academic Task 1

100 Band 9 Task 1 Samples

Real Exam Charts, Maps, and Processes

₹299$9.99CAD 13.99AUD 14.99£7.99NZD 16.99€8.99AED 39SGD 12.99

Free preview

Academic Task 1

IELTS Academic Task 1, Decoded

Graphs, Maps, and Processes Explained

₹299$9.99CAD 13.99AUD 14.99£7.99NZD 16.99€8.99AED 39SGD 12.99

Free preview

Vocabulary

Upgrade Your English

1,800 Sentences from Band 5 to Band 9

₹299$9.99CAD 13.99AUD 14.99£7.99NZD 16.99€8.99AED 39SGD 12.99

Free preview

Next question: Bar Graph #153
