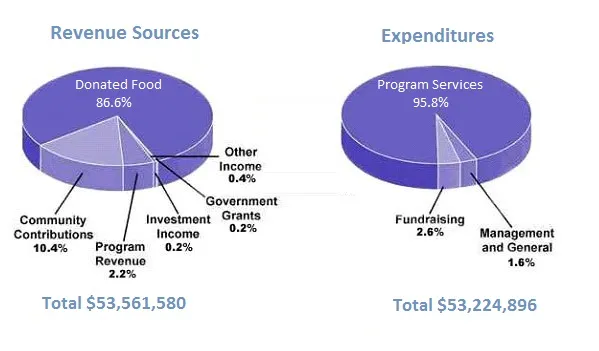
The pie chart illustrates the financial transactions, both income and expenditure, of a children's charity based in the United States over a one-year period.
At a glance, it is evident that the charity's main source of income was through donations, while the largest proportion of its expenditure was on program services. The charity also received funds from other sources and spent money on other areas, but to a lesser extent.
In terms of income, donations made up more than half of the total, at 60%. The remaining 40% was divided equally between government grants and other income, each contributing 20%. This shows that the charity was heavily reliant on public generosity for its funding.
On the expenditure side, program services accounted for the lion's share, consuming 80% of the charity's total spending. The remaining 20% was split evenly between administration and fundraising, each taking up 10%. This indicates that the charity prioritized direct services to children over administrative and fundraising costs.


