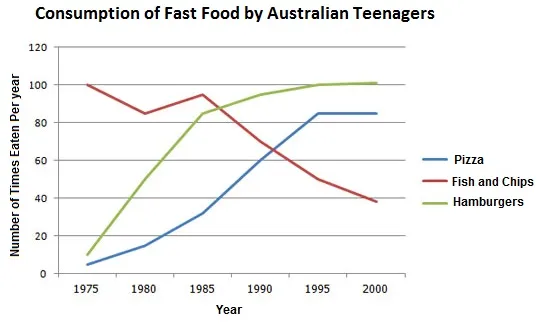
The line graph illustrates the variations in the quantity and kind of fast food consumed by adolescents in Australia between 1975 and 2000.
The graph reveals a general increase in the consumption of all types of fast food over the 25-year period. However, the popularity of different fast food items changed significantly during this time.
In 1975, the most consumed fast food was fish and chips, with pizza being the least popular. However, by 2000, consumption of fish and chips had dramatically decreased, while pizza consumption had risen sharply to become the most popular fast food.
The consumption of hamburgers and fried chicken also increased, but at a more gradual rate. By 2000, the consumption of these two types of fast food was similar, both being more popular than fish and chips but less popular than pizza. Despite these changes, the total consumption of fast food by Australian teenagers continued to rise throughout the period.


