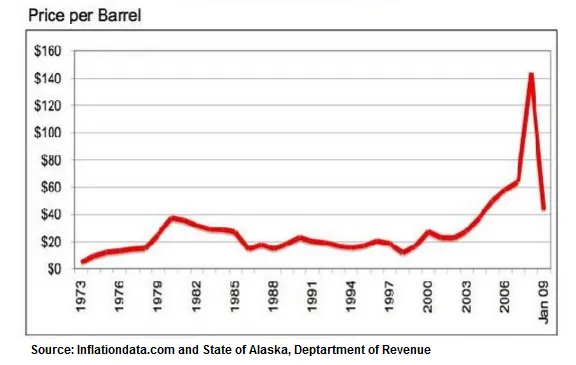
The line graph illustrates the fluctuations in the cost of oil per barrel over a period of approximately 36 years, from 1973 to January 2009.
A general observation of the graph reveals a trend of increasing oil prices over the years, with a few significant spikes and drops. The highest peak was reached in 2008, and the lowest point was in the early 1970s.
In detail, the price of oil per barrel started at around $20 in 1973, and it experienced a sharp increase to just over $60 in 1980. This was followed by a period of decline and relative stability until 2000, with prices hovering around $20 to $40.
From 2000 onwards, the cost of oil experienced a dramatic surge, reaching its zenith at nearly $140 in 2008. However, this was followed by an equally dramatic fall to around $40 in January 2009, demonstrating the volatile nature of oil prices during this period.


