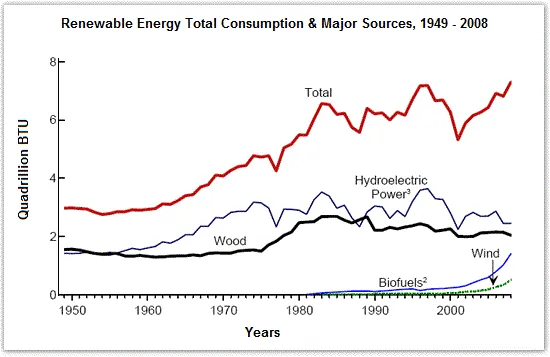
The provided diagram illustrates the use of renewable energy sources in the United States over a span of 59 years, from 1949 to 2008.
The general trend observed from the diagram is an overall increase in the consumption of renewable energy, with some fluctuations, and a noticeable growth in the use of biofuels. It is also evident that the consumption of hydroelectric power, while initially high, has seen a gradual decrease over the years.
In 1949, the consumption of hydroelectric power was the highest among the renewable energy sources, standing at around 2 quadrillion Btu. However, by 2008, this had fallen to just over 2 quadrillion Btu, despite a peak of almost 4 quadrillion Btu in the mid-1970s. The use of solar/wind power remained relatively constant throughout the period, with a slight increase in the 2000s.
In contrast, the consumption of biofuels started from a negligible amount in 1949 but showed a dramatic increase from the mid-1980s, reaching nearly 2 quadrillion Btu by 2008. The use of wood also saw a gradual increase from just over 1 quadrillion Btu in 1949 to approximately 2 quadrillion Btu in 2008, with a slight dip in the 1980s.


