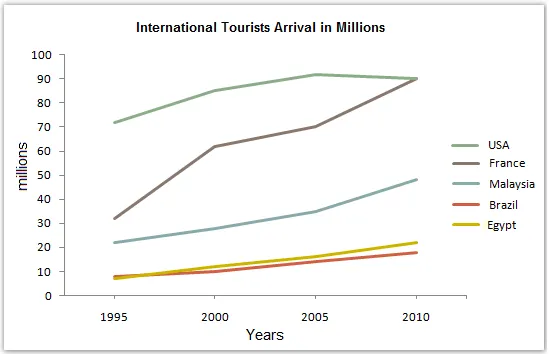
The line graph delineates the number of international tourists visiting five different nations over a span of 20 years, from 1995 to 2015.
In general, all countries experienced an upward trend in the number of international tourists, with some countries witnessing a more significant increase than others. The fluctuations in the number of visitors were also quite noticeable in certain countries throughout the period.
In 1995, Country D had the highest number of tourists, which then saw a gradual increase until it peaked in 2005. However, it experienced a sharp decline in the following years, and by 2015, the number of tourists had fallen dramatically. In contrast, Country E had the least number of visitors in 1995, but it saw a steady and significant increase over the years, surpassing all other countries by 2015.
Countries A, B, and C also saw an increase in the number of tourists over the 20-year period, but the growth was more moderate compared to Countries D and E. Country B, in particular, experienced a slight dip in 2005 before recovering and continuing its upward trend. Country A maintained a steady growth rate throughout, while Country C saw a slight decline in 2005, but recovered quickly and continued to grow until 2015.


