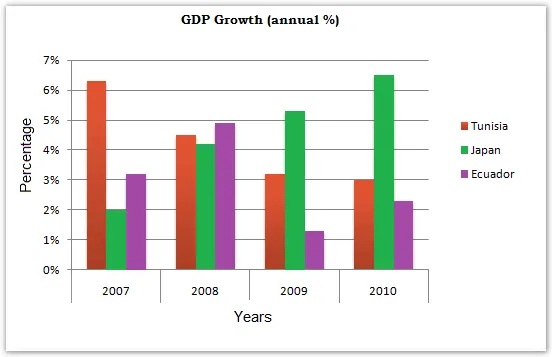
The provided bar chart illustrates the annual GDP growth of three different countries, namely the USA, China, and India, over a span of four years from 2007 to 2010.
In general, all three countries experienced fluctuations in their GDP growth during the given period. However, China consistently maintained the highest growth rate, while the USA saw the most significant decline.
Looking more closely, China's GDP growth was the highest in 2007 at approximately 14%, but it gradually declined to around 10% by 2010. Despite this decrease, China's growth rate was still considerably higher than that of the other two countries. On the other hand, India's GDP growth remained relatively stable, with a slight dip in 2008 and 2009, before rebounding to roughly 9% in 2010.
Contrastingly, the USA started with a GDP growth of about 2% in 2007, which fell dramatically to negative growth in 2008 and 2009 due to the global financial crisis. Although a slight recovery was observed in 2010, the growth rate was still less than 3%, the lowest among the three countries.


