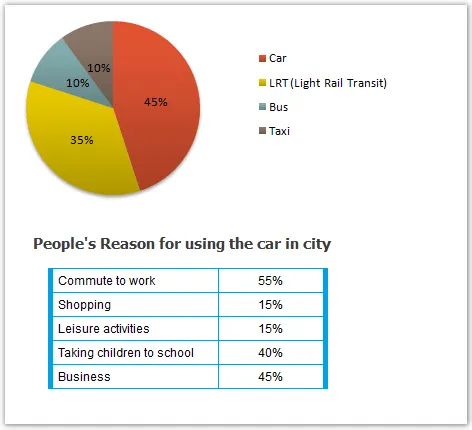
The diagrams provide data on the modes of transportation used and the frequency of car usage in the city of Edmonton.
The graphs generally depict a higher usage of cars compared to other means of transport, and a significant proportion of cars being used less frequently. The details, however, reveal some interesting patterns and contrasts.
Looking at the first graph, it is evident that over half of the population prefers to use cars (55%), followed by cyclists and pedestrians at 35%. The remaining 10% is shared equally between bus and train commuters. This clearly indicates that private vehicles are the most popular mode of transport in Edmonton.
As for car usage, the second graph illustrates that a considerable 45% of cars are used less than three times a week. In contrast, 25% of cars are used three to five times a week, and the remaining 30% are used daily. This suggests that while cars are the preferred mode of transport, they are not necessarily used on a daily basis by a large portion of the population.


