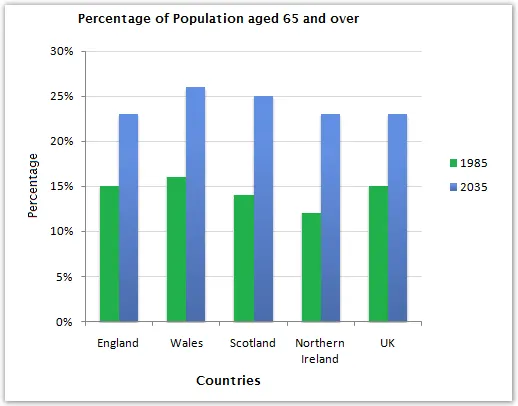
The bar chart delineates the alteration in the age distribution of the UK's population between 1985 and a forecast for 2035.
The overall trend indicates a significant increase in the elderly population over the 50-year period, while the proportion of younger people is projected to decline. It is also noteworthy that the age group 65-74 is expected to witness the most substantial growth.
In 1985, the highest proportion of the population was in the 25-34 age bracket, accounting for about 29%, followed by those aged 35-44 and 45-54, both of which comprised approximately 22%. However, the number of people aged 65 and over was relatively low, with the 65-74 and 75+ age groups making up only 8% and 5% respectively.
By contrast, the 2035 projection suggests a dramatic shift in the UK's demographic profile. The 65-74 age group is predicted to constitute the largest segment of the population at around 30%, while the 75+ age group is also expected to rise significantly to 24%. Meanwhile, the younger age groups are all forecast to decrease, with the 25-34, 35-44, and 45-54 age brackets all falling to around 15%.


