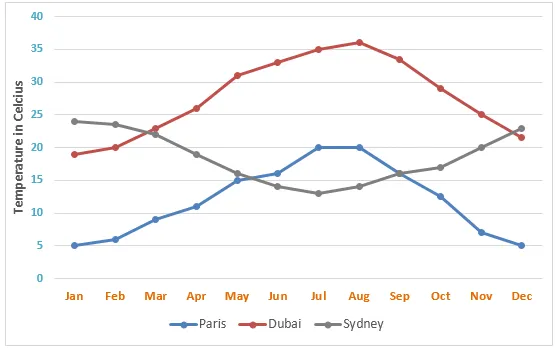
The line graph provides information about the mean monthly temperatures in three major cities over a year.
At a glance, it is evident that each city experiences distinct temperature patterns throughout the year, with one city maintaining relatively consistent temperatures, while the other two exhibit significant fluctuations. Additionally, there is a clear correlation between the time of year and temperature changes in each city.
In terms of specific details, City A's temperature varies dramatically from around -5 degrees in January to approximately 25 degrees in July. Similarly, City B also sees a considerable shift from roughly 15 degrees in January to a peak of 40 degrees in July. However, after July, both cities experience a steady decrease in temperature, returning to their starting points by December.
In contrast, City C's temperature remains relatively stable throughout the year, hovering around 20 degrees. There is a slight increase to about 25 degrees in the middle of the year, around June and July, before it drops back to the average temperature. This suggests a minimal seasonal impact on City C's climate compared to the other two cities.


