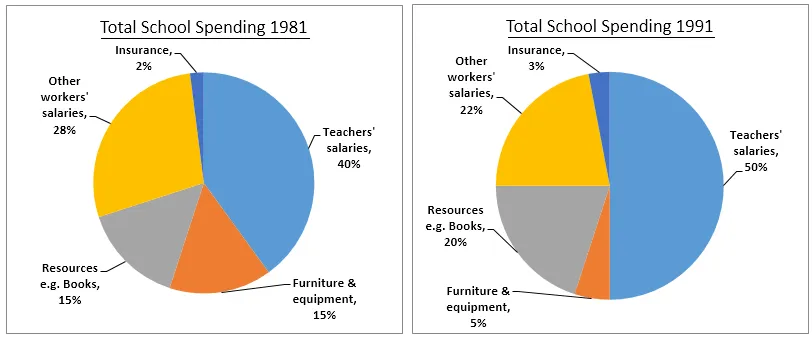
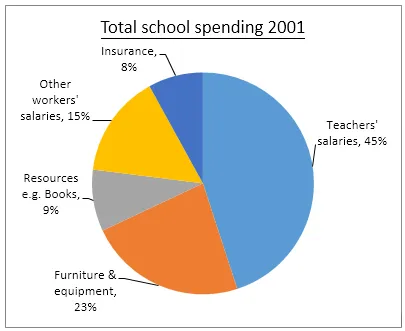
The pie charts illustrate the alterations in yearly expenditure by a specific British school over a period of 20 years, starting from 1981 and ending in 2001.
In general, it can be observed that while spending on teachers' salaries saw a significant decrease, the outlay on school resources experienced a substantial increase. The proportion of funds allocated to other workers' wages and insurance remained relatively stable throughout the period.
In 1981, more than half of the budget was dedicated to teachers' salaries (60%), with a further 28% going to resources. The remaining funds were split evenly between other workers' wages and insurance, each receiving 6%. By 1991, the proportion of spending on teachers' salaries had dropped to 50%, while the allocation for resources had risen to 35%. Other workers' wages and insurance still received 6% and 9% respectively.
By 2001, the expenditure on teachers' salaries had further reduced to 45% and the funds for resources had escalated to 40%. The percentage of spending on other workers' wages had increased slightly to 11%, while the proportion allocated to insurance remained unchanged at 4%.


