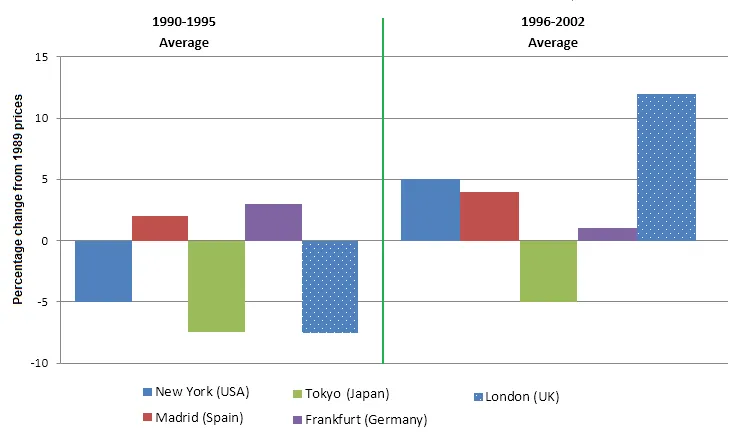
The chart illustrates the variations in the average cost of housing in five distinct cities from 1990 to 2002, relative to the prices in 1989.
The overall trend indicates that all cities experienced a rise in house prices during this period, albeit at different rates. New York and Tokyo saw the most dramatic increases, while London's growth was more moderate.
From 1990 to 1995, New York's housing prices soared, peaking at 350% of the 1989 average. Although the prices fell slightly after this peak, they remained significantly higher than in any other city. Tokyo's housing market also experienced a sharp rise, reaching 325% of the 1989 average in 1992 before gradually declining to 200% by 2002.
In contrast, London's house prices rose steadily from 100% in 1990 to 200% in 2002. Madrid and Frankfurt saw relatively modest increases, with Madrid's prices peaking at 150% in 2002 and Frankfurt's prices fluctuating around 125% during the same period.


