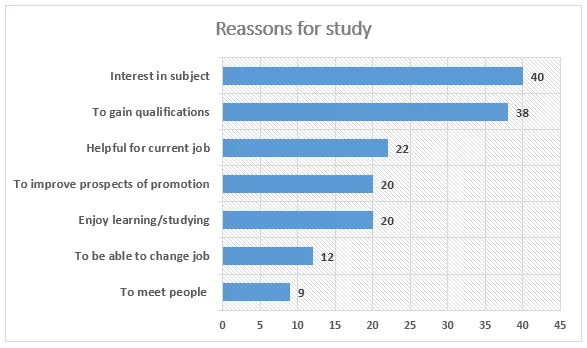
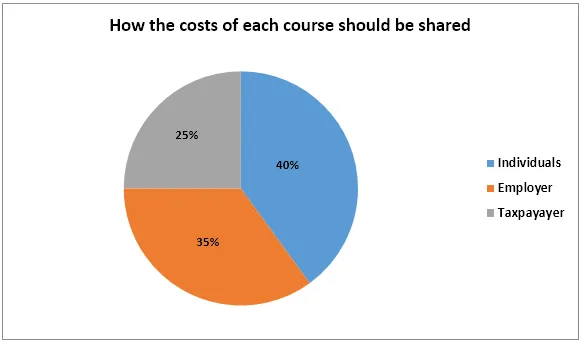
The bar chart and pie diagram illustrate the motives behind adults' choice to pursue education and the perceived distribution of its financial burden respectively.
A general overview of the bar chart reveals that interest is the primary driver for adults to study, while the pie chart suggests that most people believe the cost of adult education should be jointly borne by taxpayers, employers, and the students themselves.
Delving into the details of the bar chart, it is evident that the majority of adults, approximately 40%, study out of interest. Career progression and gaining qualifications follow closely, both hovering around 20%. The least common reasons, each below 10%, are to meet people and to help children with their studies.
On the other hand, the pie chart shows a relatively even distribution of the financial responsibility of adult education. The largest portion, 40%, is expected to be covered by taxpayers, followed by employers and students, each contributing approximately 35% and 25% respectively.


