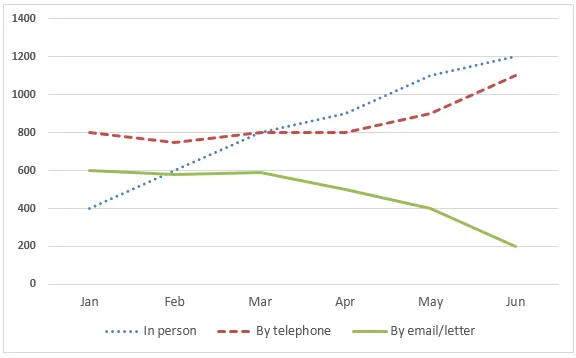
The line graph illustrates the quantity of queries received by a tourist information centre through three different modes of communication - telephone, letter/email, and in-person visits - during the first half of 2001.
From a general perspective, it is clear that all three methods experienced fluctuations over the period. However, telephone enquiries were consistently the most popular, while letter/email enquiries were the least favoured.
In January, the number of telephone enquiries was approximately 2500, which experienced a steady increase to reach a peak at 3500 in March, followed by a gradual decline to around 1500 in June. In contrast, the number of in-person enquiries began at around 2000, dropped to just over 1000 in February, then fluctuated before ending at approximately 1800 in June.
The number of letter/email enquiries remained relatively stable throughout the period, starting and ending at around 1000, with a slight increase to just over 1500 in March and April. It is noteworthy that this was the only method that did not experience any significant drops during the six-month period.


