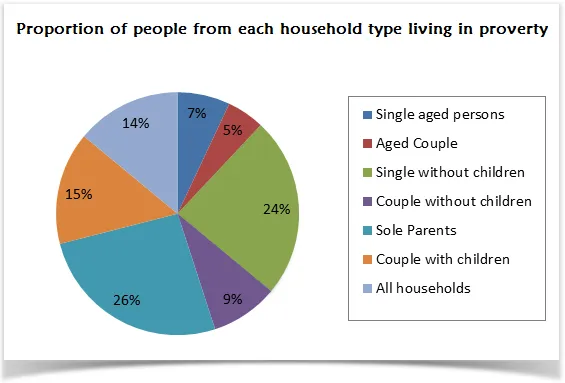
The pie chart provides information about the relative percentages of various family types that were living in poverty in the United Kingdom in 2002.
The chart reveals a clear dominance of two family categories in poverty, while the remaining types constitute a minor part. It is also evident that the single parent category is the most affected by poverty.
Delving into the details, single parents represent the highest proportion of families living in poverty, accounting for 26%. This is closely followed by pensioners, who make up 24% of the impoverished families, indicating that these two categories combined constitute half of the total.
On the other hand, the remaining categories, namely couples with children, couples without children, and single adults, represent a lesser percentage of families in poverty. Specifically, couples with children and couples without children each account for 19%, while single adults represent a significantly smaller proportion at 12%. This suggests that poverty is less prevalent among these family types.


