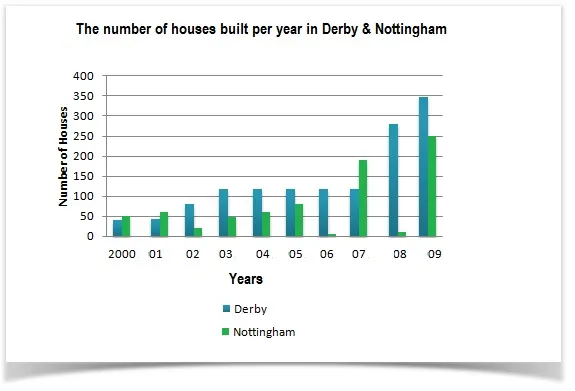
The provided diagram illustrates the annual construction of houses in Derby and Nottingham, two cities in the United Kingdom, over a span of ten years from 2000 to 2009.
Generally, it can be observed that both cities experienced fluctuations in the number of houses built each year. However, Derby consistently had a higher number of constructions compared to Nottingham throughout the period.
From 2000 to 2003, Derby saw a steady increase in house construction, peaking at around 350 houses in 2003 before experiencing a sharp drop to approximately 200 houses in 2004. Despite a brief recovery in 2005, the number of houses built continued to decline, reaching its lowest point in 2009 with just over 100 houses.
On the other hand, Nottingham had a relatively stable number of constructions in the initial years, hovering around 100 houses per year until 2004. Thereafter, a significant increase was observed in 2005, with nearly 250 houses built. However, this was followed by a steep decline in the subsequent years, with the number of houses built in 2009 being similar to that in 2000.


