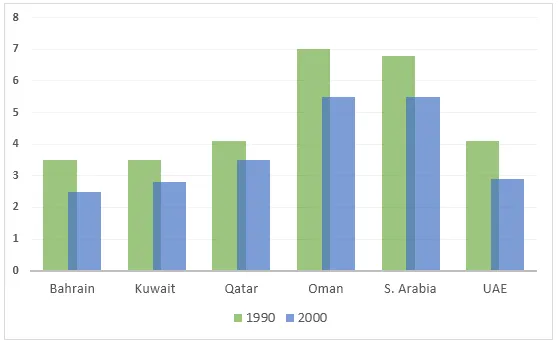
The line graph illustrates the changes in fertility rates among women in various Gulf nations over a decade from 1990 to 2000.
At a glance, it can be observed that all countries experienced a decline in fertility rates during this period, albeit at different rates. Additionally, some countries, such as the UAE, started with higher fertility rates than others, such as Oman.
In 1990, the UAE had the highest fertility rate among the countries shown, at around 7.5 children per woman, but this figure had fallen dramatically to just over 4 by 2000. Similarly, Saudi Arabia saw a significant drop from approximately 7 to 4.5 children per woman over the same period.
In contrast, countries like Oman and Qatar, which initially had lower fertility rates, experienced more gradual declines. In 1990, Oman's fertility rate was around 6, and by 2000, it had decreased to just under 5. Meanwhile, Qatar's fertility rate fell from just over 5 to roughly 4 children per woman.


