IELTS HUB
Combination food spendingAustraliarestaurants Graph #274
Academic Writing Task 1

You should spend about 20 minutes on this task.

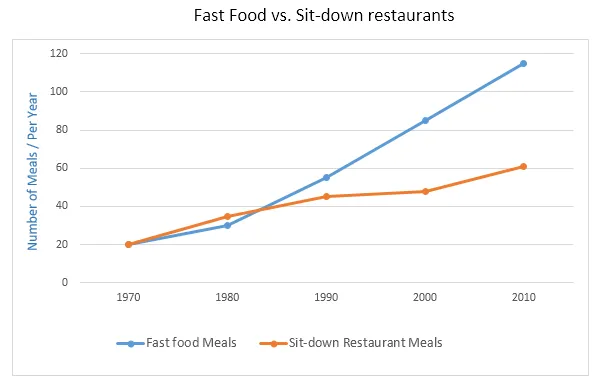
The charts below show the percentage of food budget the average Australian family spent on restaurant meals in different years. The graph shows the number of meals eaten in fast food restaurants and sit-down restaurants.

Combination: Australian restaurant spending and meal consumption trends (visual 1 of 2)Combination: Australian restaurant spending and meal consumption trends (visual 2 of 2)

Summarise the information by selecting and reporting the main features, and make comparisons where relevant.

Write at least 150 words.

One box per paragraph, then compare with Band 9.
192 words · 4 paragraphs
Introduction

The provided diagrams illustrate the proportion of the average Australian family's food expenditure allocated to dining out, as well as the frequency of meals consumed in fast-food and sit-down restaurants over various years.

Overview

In general, there was a noticeable rise in the percentage of the food budget spent on restaurant meals over the years. Additionally, the number of meals eaten in both types of restaurants saw a significant increase.

Body 1

In 1970, the average Australian family spent just over 10% of their food budget on restaurant meals, which doubled to approximately 20% by 1980. This figure continued to rise steadily, reaching almost 40% by 2010. Simultaneously, the frequency of meals eaten in fast-food restaurants saw a dramatic increase from around 20 meals per year in 1970 to over 150 meals by 2010.

Body 2

In contrast, the number of meals consumed in sit-down restaurants was relatively low, starting from just under 10 meals per year in 1970. However, this figure also rose over the years, albeit at a slower pace, reaching around 50 meals per year by 2010. Despite the slower growth, this still represents a significant shift in dining habits over the 40-year period.
How our answers are made

Go further with the books

Academic Task 1

100 Band 9 Task 1 Samples

Real Exam Charts, Maps, and Processes

₹299$9.99CAD 13.99AUD 14.99£7.99NZD 16.99€8.99AED 39SGD 12.99

Free preview

Academic Task 1

IELTS Academic Task 1, Decoded

Graphs, Maps, and Processes Explained

₹299$9.99CAD 13.99AUD 14.99£7.99NZD 16.99€8.99AED 39SGD 12.99

Free preview

Vocabulary

Upgrade Your English

1,800 Sentences from Band 5 to Band 9

₹299$9.99CAD 13.99AUD 14.99£7.99NZD 16.99€8.99AED 39SGD 12.99

Free preview

Next question: Table #275