IELTS HUB
Line Graph Torontometropassengers Graph #35
Academic Writing Task 1

You should spend about 20 minutes on this task.

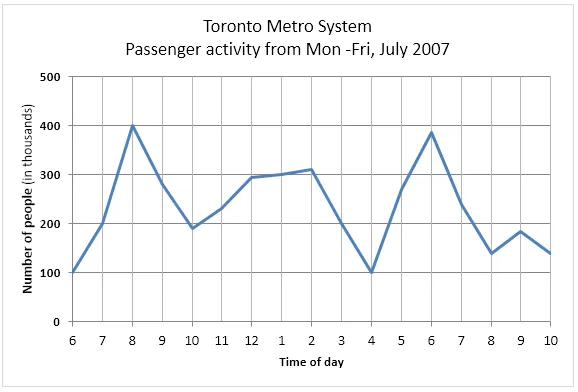
The graph below shows the weekday volume of passenger activity on the Toronto Metro system for July 2007.

Line Graph: Toronto Metro weekday passenger activity July 2007

Summarise the information by selecting and reporting the main features, and make comparisons where relevant.

Write at least 150 words.

One box per paragraph, then compare with Band 9.
153 words · 4 paragraphs
Introduction

The line graph illustrates the daily number of passengers using the Toronto Metro system during the weekdays of July 2007.

Overview

The graph reveals two distinct peak periods of passenger activity, with a noticeable dip in between. Overall, there is a significant increase in passenger volume during the morning and evening hours, while the numbers drop during the middle of the day.

Body 1

In the morning, passenger activity begins to rise sharply from 6 am, reaching its peak at around 8 am with approximately 120,000 passengers. After this peak, there is a steady decline until midday, where the numbers plateau at around 20,000 passengers for several hours.

Body 2

In the evening, the volume of passengers starts to climb again from 4 pm, peaking at 6 pm with nearly 140,000 passengers. Following this, there is a rapid decrease in passenger activity, falling to its lowest point at 10 pm with roughly 10,000 passengers.


How our answers are made

Go further with the books

Academic Task 1

100 Band 9 Task 1 Samples

Real Exam Charts, Maps, and Processes

₹299$9.99CAD 13.99AUD 14.99£7.99NZD 16.99€8.99AED 39SGD 12.99

Free preview

Academic Task 1

IELTS Academic Task 1, Decoded

Graphs, Maps, and Processes Explained

₹299$9.99CAD 13.99AUD 14.99£7.99NZD 16.99€8.99AED 39SGD 12.99

Free preview

Writing Task 2

100 Essential IELTS Essays

Band 9 Sample Answers for the Real Exam

₹199$6.99CAD 8.99AUD 9.99£4.99NZD 10.99€5.99AED 24SGD 8.99

Free preview

Next question: Pie Chart #36
