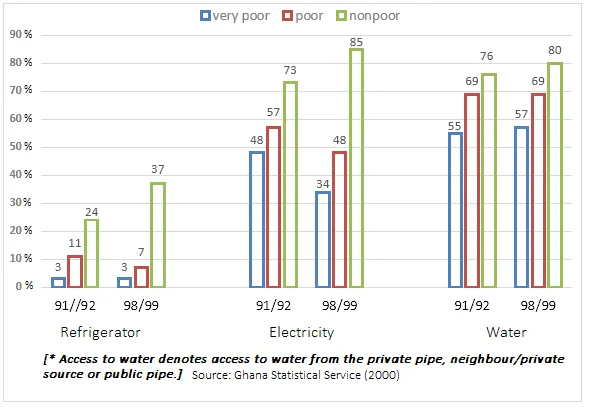
The provided graph illustrates the proportion of households in Ghana, classified according to poverty levels, and their access to basic amenities such as refrigeration, electricity, and water over a period from 1991/1992 to 1998/1999.
At a glance, it can be seen that access to these three utilities increased overall during the period, with a noticeable disparity between the poorest and the richest households. Water was the most accessible utility, while refrigeration was the least accessible for all economic groups.
In 1991/1992, a significant majority of the richest households had access to electricity, approximately 70%, which rose to nearly 90% by 1998/1999. However, the poorest households saw a modest increase from around 5% to just under 20%. Similarly, access to refrigeration for the wealthiest households rose from just over 40% to nearly 70%, while the poorest households saw an increase from nearly non-existent to a meager 5%.
Access to water showed a different trend. In 1991/1992, about 60% of the richest households had access to water, increasing to nearly 80% by 1998/1999. The poorest households also saw a significant increase from just over 20% to nearly 50%. Despite the improvements, the gap between the richest and poorest households remained substantial in terms of access to these basic amenities.


