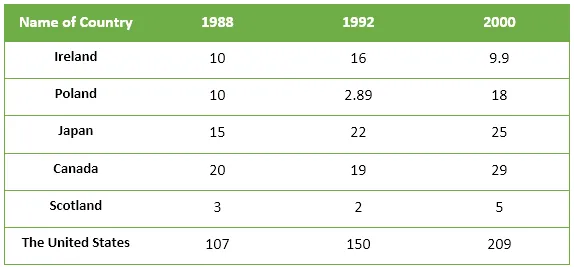
The table illustrates the quantity of waste generated, measured in million tonnes, in six distinct nations over a period of three years.
From a general perspective, it is evident that all six countries witnessed an increase in waste production over the given period. However, the rate of increase varied significantly, with some countries experiencing a more dramatic rise than others.
Turning to the specifics, in the initial year, the USA was the largest producer of waste, generating 220 million tonnes. Despite this, over the following two years, the USA saw a relatively modest increase of 10 million tonnes per year. Conversely, India, which started with a relatively low waste production of 100 million tonnes, experienced a substantial growth rate, with waste production reaching 170 million tonnes by the end of the third year.
In contrast, the remaining four countries - China, Brazil, Japan and Germany - all saw relatively steady increases in waste production. Of these, China's growth was the most significant, rising from 140 to 180 million tonnes over the three years, while Germany's increase was the most modest, from 80 to 90 million tonnes.


