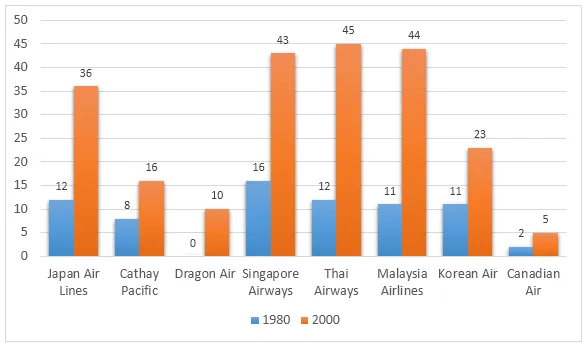
The line graph delineates the weekly frequency of flights from various airlines to Hong Kong in the years 1980 and 2000.
At a glance, it is evident that all airlines experienced an increase in the number of flights over the 20-year period, with certain airlines witnessing a more significant surge than others. The overall trend indicates a growth in air traffic to Hong Kong.
In 1980, Airline A had the highest frequency with approximately 50 flights per week, while airlines B and C had around 20 and 10 flights respectively. By 2000, Airline A had doubled its weekly flights to about 100, while Airline B saw an impressive five-fold increase to roughly 100 flights as well. Airline C, despite having the lowest frequency in 1980, experienced the most dramatic growth, reaching nearly 140 flights per week by 2000.
In contrast, Airline D, which did not have any flights to Hong Kong in 1980, began operations in the intervening years and by 2000, had about 60 weekly flights. This suggests that the aviation market in Hong Kong expanded between 1980 and 2000, attracting new players and prompting existing airlines to increase their flight frequencies.


