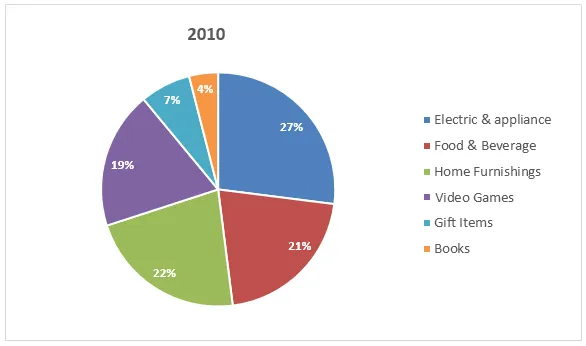
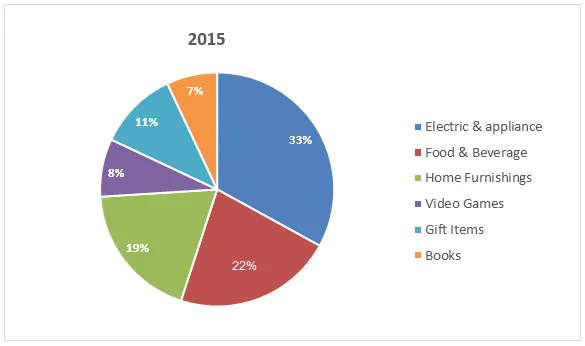
The pie diagrams illustrate the proportion of internet sales in different retail sectors in Australia in the years 2010 and 2015.
A broad analysis of the charts reveals a significant growth in the online sales of the clothing sector, while the food sector witnessed a decline in the same period. The other sectors remained relatively stable in terms of their online sales.
In 2010, the food sector dominated the online sales with a share of 45%, followed by the clothing sector at 22%. The remaining sectors including electronics, furniture and others accounted for 33% of the total sales. However, by 2015, the clothing sector saw a dramatic rise to 35%, becoming the leading sector in online sales.
In contrast, the food sector experienced a decrease to 32% in 2015. The other sectors, despite minor fluctuations, maintained a relatively similar proportion of the online sales, with electronics at 17%, furniture at 10% and others at 6%. This highlights the dynamic nature of consumer preferences in online shopping over the five-year period.


