IELTS HUB
Bar Graph soapTurkeytourism Graph #71
Academic Writing Task 1

You should spend about 20 minutes on this task.

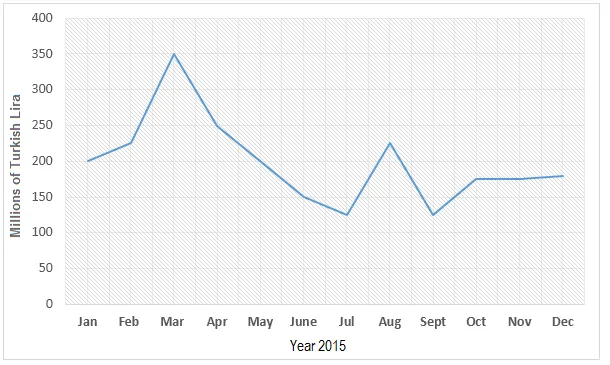
The chart below shows the sales of handmade olive oil soaps to tourists in Turkey in 2015.

Bar Graph: Handmade olive oil soap sales to tourists

Summarise the information by selecting and reporting the main features, and make comparisons where relevant.

Write at least 150 words.

One box per paragraph, then compare with Band 9.
169 words · 4 paragraphs
Introduction

The bar chart illustrates the quantity of handcrafted olive oil soaps sold to visitors in Turkey during the year 2015.

Overview

At a glance, it can be seen that the sales fluctuated throughout the year, with a noticeable peak in the summer months and a significant dip in the winter. The most striking feature is the sharp contrast between the highest and lowest sales figures.

Body 1

Delving into the details, the sales began at a moderate level in January, with approximately 1,000 units sold. The figures then experienced a steady rise, peaking at around 6,000 units in August, the height of the tourist season. This was followed by a gradual decline as the tourist season ended, dropping back to around 1,000 units in December.

Body 2

In contrast, the winter months of January, February, and December witnessed the lowest sales, with figures hovering around the 1,000 mark. This could be attributed to the decrease in tourist arrivals during the colder months, resulting in lower demand for the handcrafted soaps.


How our answers are made

Go further with the books

Academic Task 1

100 Band 9 Task 1 Samples

Real Exam Charts, Maps, and Processes

₹299$9.99CAD 13.99AUD 14.99£7.99NZD 16.99€8.99AED 39SGD 12.99

Free preview

Academic Task 1

IELTS Academic Task 1, Decoded

Graphs, Maps, and Processes Explained

₹299$9.99CAD 13.99AUD 14.99£7.99NZD 16.99€8.99AED 39SGD 12.99

Free preview

Vocabulary

Upgrade Your English

1,800 Sentences from Band 5 to Band 9

₹299$9.99CAD 13.99AUD 14.99£7.99NZD 16.99€8.99AED 39SGD 12.99

Free preview

Next question: Bar Graph #72
