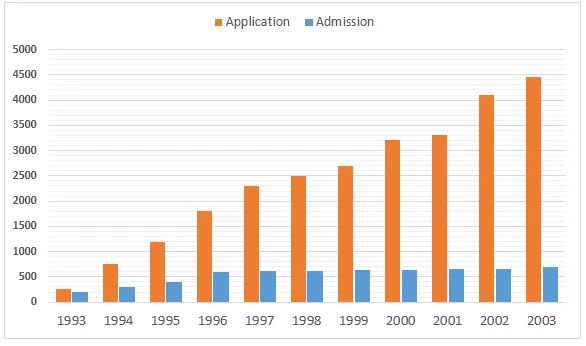
The graph provides information about the number of individuals who applied for admission and those who were successfully admitted into a university over a ten-year period.
From a general perspective, it can be observed that the number of applicants showed a consistent increase over the years, while the number of students who gained admission fluctuated. There was also a noticeable gap between the two figures throughout the decade.
In the initial years, from 2000 to 2003, the number of applicants rose steadily from about 2,000 to approximately 5,000, while the number of admissions only increased marginally from around 1,000 to just over 1,500. This discrepancy between applicants and admissions started to widen, indicating a growing selectivity in the admission process.
Between 2004 and 2010, the number of applicants surged dramatically, peaking at 10,000 in 2010. However, the number of admissions did not follow the same pattern. It peaked at around 3,500 in 2006, before gradually declining to about 2,500 in 2010. This suggests that despite the increase in applicants, the university maintained a high admission standard, accepting only a fraction of the applicants each year.


