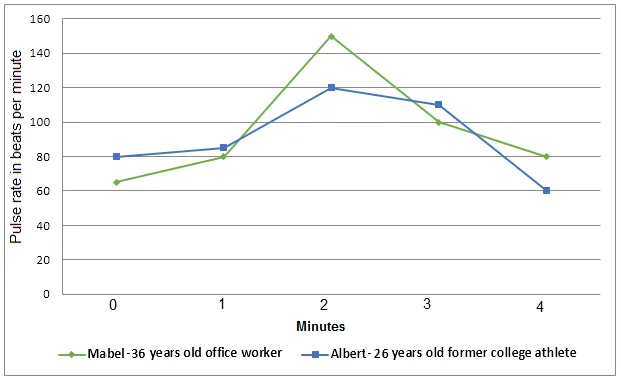
The line graph delineates the variations in pulse rate for two distinct individuals, differing in age and occupation, over a specific period.
At a general level, it is evident that both individuals experienced fluctuations in their pulse rates, although the younger individual, a professional athlete, had a more pronounced and rapid change compared to the older, office worker. Additionally, the athlete's pulse rate was consistently higher than that of the office worker.
Delving into the details, the athlete's pulse rate began at around 70 beats per minute (bpm), peaked at approximately 160 bpm during the middle of the day, and then gradually decreased to about 80 bpm by the end of the day. This could be attributed to the physical activities the athlete engaged in during the day.
On the other hand, the office worker's pulse rate remained relatively stable, starting at about 60 bpm and only slightly increasing to approximately 80 bpm during the day before returning to the initial rate. This minimal change in pulse rate could be due to the sedentary nature of the office worker's job.


