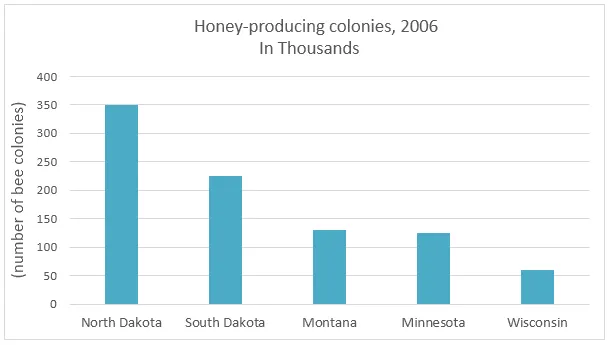
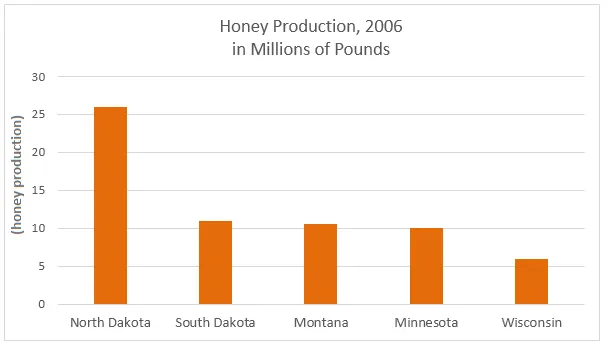
The bar charts illustrate the quantity of honey produced and the number of honey-producing colonies in five different states of America in 2006.
The charts reveal that there is a significant variation in honey production and the number of honey-producing colonies across the states. However, it is not always the case that a higher number of colonies results in more honey production.
Focusing on the honey production, North Dakota was the largest producer with 33 million pounds, nearly double that of Montana, which came second with 18 million pounds. South Dakota, Idaho, and Florida produced considerably less, with Florida producing the least at just 10 million pounds.
In terms of honey-producing colonies, North Dakota again led the way with 460,000 colonies. However, Florida, despite being the lowest honey producer, had the second highest number of colonies at 240,000. Interestingly, Montana had fewer colonies than Florida but produced significantly more honey, suggesting that the productivity of each colony in Montana was higher.


