IELTS HUB
Table researchtechnologyworkforce Graph #91
Academic Writing Task 1

You should spend about 20 minutes on this task.

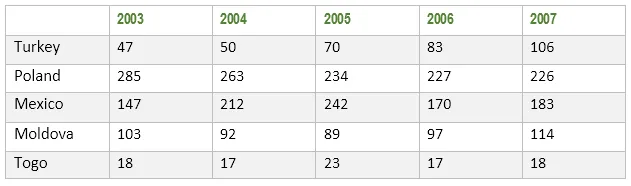
The table gives information about the number of people working as researchers in technology per million people in five countries.

Table: Technology researchers per million people in countries

Summarise the information by selecting and reporting the main features, and make comparisons where relevant.

Write at least 150 words.

One box per paragraph, then compare with Band 9.
147 words · 4 paragraphs
Introduction

The table presents data on the quantity of individuals employed as technology researchers per million inhabitants in five distinct nations.

Overview

At a glance, it is clear that the highest number of technology researchers per million population is found in Japan, whereas the least is in India. Additionally, the figures for the other three countries lie somewhere in between these two extremes.

Body 1

Looking more closely, Japan stands out with a staggering 5478 researchers per million people, which is significantly higher than the other four countries. The United States follows with 4251, while Germany and the UK have relatively similar figures at 3750 and 3245 respectively.

Body 2

In contrast, India, despite its large population, has a considerably lower number of technology researchers per million people, standing at just 157. This is a stark contrast to the other nations and indicates a potential area for growth in the Indian technology sector.


Go further with the books

Academic Task 1

100 Band 9 Task 1 Samples

Real Exam Charts, Maps, and Processes

₹299$9.99CAD 13.99AUD 14.99£7.99NZD 16.99€8.99AED 39SGD 12.99

Free preview

Academic Task 1

IELTS Academic Task 1, Decoded

Graphs, Maps, and Processes Explained

₹299$9.99CAD 13.99AUD 14.99£7.99NZD 16.99€8.99AED 39SGD 12.99

Free preview

Vocabulary

Upgrade Your English

1,800 Sentences from Band 5 to Band 9

₹299$9.99CAD 13.99AUD 14.99£7.99NZD 16.99€8.99AED 39SGD 12.99

Free preview

Next question: Table #92
