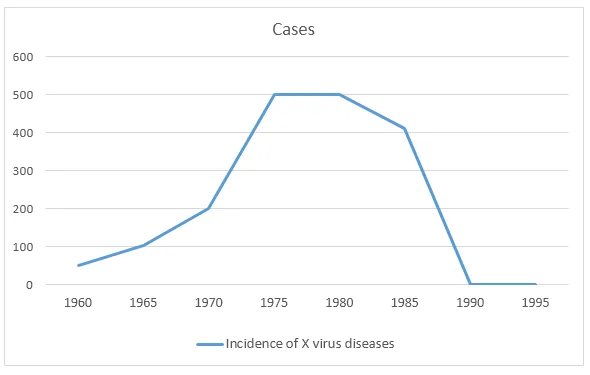
The line graph provides information about the number of disease instances linked to the X virus in Australia over a 35-year period from 1960 to 1995.
The graph reveals a general upward trend in the number of cases over the period, with some significant fluctuations. The highest number of cases was recorded in the mid-1980s, while the lowest was in the early 1960s.
In 1960, the number of cases was relatively low, at around 100. This figure gradually increased over the next decade, reaching approximately 200 by 1970. However, the following decade saw a dramatic rise in the number of cases, peaking at around 800 in 1985.
After this peak, there was a sharp decline to about 600 cases in 1990. Despite a slight increase in the early 1990s, the number of cases fell again to around 500 by 1995. This indicates a decrease in the prevalence of the disease towards the end of the period.


