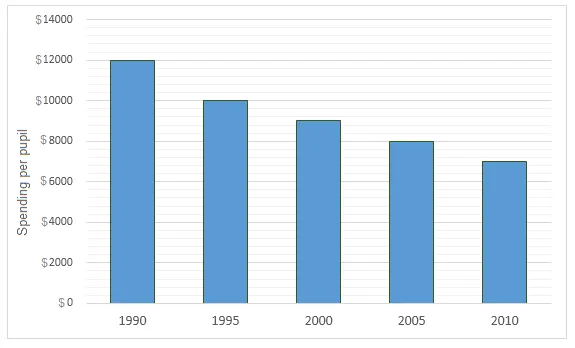
The bar charts illustrate the annual expenditure on each student at Riverdale Public School and the proportion of pupils who successfully passed reading and mathematics examinations over a 15-year period from 1990 to 2005.
The overall trend reveals that while the school's spending per student saw a substantial increase, the pass rates in both reading and math tests fluctuated over the years. Furthermore, the passing percentage in reading was consistently higher than that in math throughout the period.
In 1990, the school spent approximately $5,000 on each student, which gradually rose to just over $10,000 by 2005, almost doubling the initial amount. Simultaneously, the pass rate in reading tests was around 70% in 1990, peaked at 80% in 1995, before experiencing a slight decline to just below 80% by 2005.
In contrast, the percentage of students passing the math test was significantly lower, starting at 55% in 1990. Despite a brief increase to 65% in 1995, the pass rate fell to 60% in 2000 and remained stagnant till 2005. This suggests that despite increased spending, the school was unable to significantly improve the math pass rate.