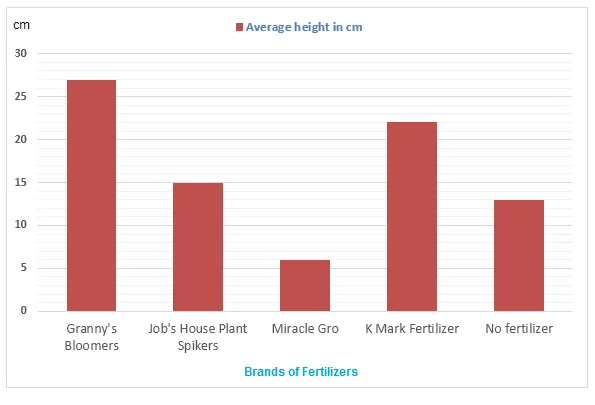
The line graph delineates the impact of various fertilizer brands on the development of bean plants over a period of 10 weeks.
The general trend of the graph suggests that all fertilizers initially boosted the growth of the plants, but the effects varied significantly between brands as time progressed. It is also noticeable that the growth rate fluctuated depending on the brand of fertilizer used.
In the initial two weeks, all brands seemed to have a similar impact on the plant growth, with a slight edge for Brand D. However, from the third week onwards, Brand D's effectiveness started to decline, while Brand B's fertilizer showed a steady increase in plant growth, peaking at around the eighth week.
Interestingly, Brand A and C's fertilizers showed a similar growth pattern, with a sharp increase until the fifth week, followed by a gradual decline. In contrast, Brand E's fertilizer had a consistent but slow increase in plant growth throughout the ten weeks, surpassing Brand D in the final weeks.


