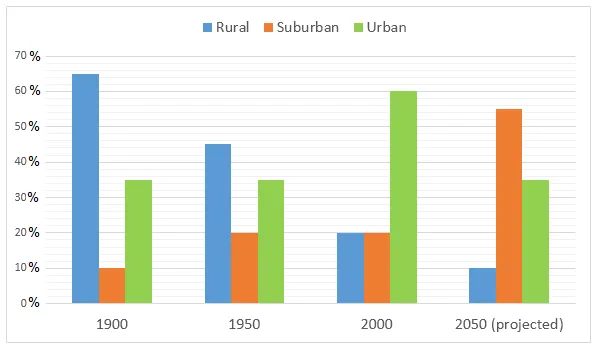
The line graph delineates the demographic distribution in the Northwest Region over a 150-year period from 1900 to 2050.
The general trend revealed by the graph is a steady increase in population over the years, with a significant surge in the mid 20th century, followed by a predicted decline towards 2050. It also indicates a notable fluctuation in the population growth rate at certain intervals.
In the early part of the century, from 1900 to around 1940, the population experienced a gradual growth. However, a dramatic rise was observed in the mid-20th century, peaking at around 1975. The population then remained relatively stable for the next few decades.
The graph predicts a slight increase in the population until 2020, after which a steady decline is expected. By 2050, the population is projected to drop to levels comparable to those of the early 1900s. This pattern suggests a cyclical nature of population growth and decline in the Northwest Region over the given period.


