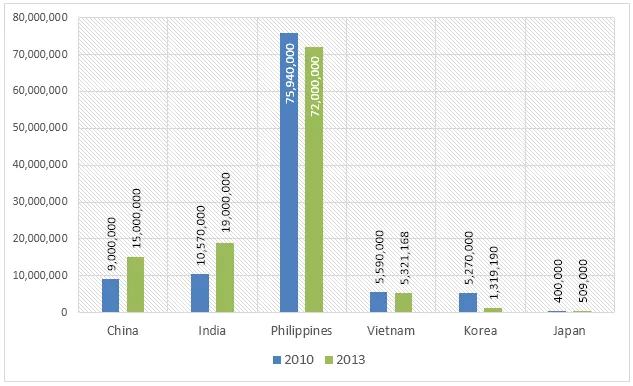
The provided graph illustrates the population of Catholics in various countries over a span of three years, from 2010 to 2013.
The graph clearly indicates a fluctuation in the number of Catholics in these nations during the given period. It is noticeable that the population of Catholics in some countries increased, while in others it decreased.
Looking more closely at the data, Brazil witnessed a significant rise in its Catholic population, from 120 million in 2010 to nearly 140 million in 2013. Similarly, the Philippines also experienced an increase, albeit less dramatic, from 75 million to just over 80 million. Conversely, the number of Catholics in Mexico and the USA showed a downward trend. In Mexico, the Catholic population fell from 96 million in 2010 to approximately 90 million in 2013, while in the USA, the decline was from 85 million to around 80 million.
In conclusion, while the Catholic population grew in Brazil and the Philippines between 2010 and 2013, it decreased in Mexico and the USA. The reasons for these changes are not provided in the data, but they suggest interesting shifts in religious affiliation during this period.


