IELTS HUB
Bar Graph dietvegetarianismadolescents Graph #112
Academic Writing Task 1

You should spend about 20 minutes on this task.

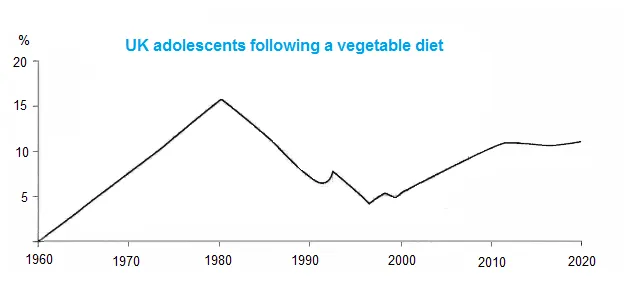
The graph shows the percentage of UK adolescents following a vegetarian diet.

Bar Graph: Percentage of UK adolescents following vegetarian diet

Summarise the information by selecting and reporting the main features, and make comparisons where relevant.

Write at least 150 words.

One box per paragraph, then compare with Band 9.
164 words · 4 paragraphs
Introduction

The line graph illustrates the proportion of teenagers in the UK who adopted a vegetarian diet over a ten-year period from 2005 to 2015.

Overview

At a glance, it is clear that there was a gradual increase in the percentage of adolescents choosing a vegetarian lifestyle throughout the decade. Additionally, it is noteworthy that the trend was more pronounced among females compared to their male counterparts.

Body 1

In 2005, the percentage of male and female adolescents following a vegetarian diet was approximately 2% and 4% respectively. Over the next five years, the figures for both genders rose steadily, with the rate of increase being slightly more rapid for females. By 2010, around 6% of males and 10% of females were vegetarians.

Body 2

The upward trend continued from 2010 to 2015, with the percentage of vegetarian males reaching nearly 8% and that of females surpassing 15%. It is interesting to note that throughout the entire period, the proportion of vegetarian females was consistently about twice that of males.


Go further with the books

Academic Task 1

100 Band 9 Task 1 Samples

Real Exam Charts, Maps, and Processes

₹299$9.99CAD 13.99AUD 14.99£7.99NZD 16.99€8.99AED 39SGD 12.99

Free preview

Academic Task 1

IELTS Academic Task 1, Decoded

Graphs, Maps, and Processes Explained

₹299$9.99CAD 13.99AUD 14.99£7.99NZD 16.99€8.99AED 39SGD 12.99

Free preview

Writing Task 2

100 Essential IELTS Essays

Band 9 Sample Answers for the Real Exam

₹199$6.99CAD 8.99AUD 9.99£4.99NZD 10.99€5.99AED 24SGD 8.99

Free preview

Next question: Pie Chart #113
