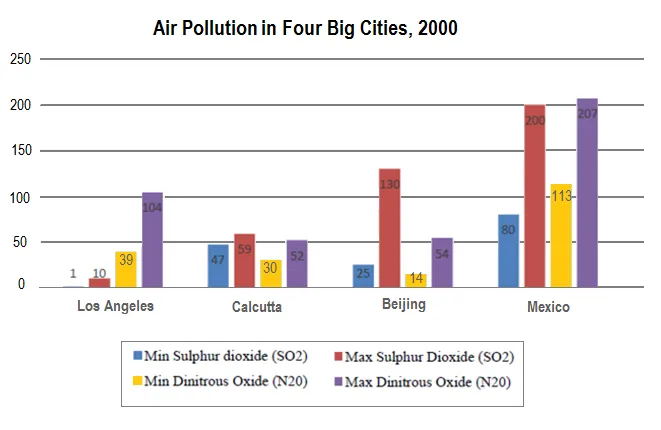
The bar chart provided illustrates the mean lowest and highest quantities of two contaminants in the atmosphere, specifically sulphur dioxide and nitrogen dioxide, in four major urban areas in the year 2000.
In general, it is noticeable that sulphur dioxide levels were higher in all four cities compared to nitrogen dioxide. Furthermore, Beijing had the highest pollution levels, while Sydney had the least.
Looking at the specifics, Beijing had the highest average daily minimum and maximum levels of sulphur dioxide at approximately 50 and 75 micrograms per cubic metre respectively. Similarly, it also had the highest levels of nitrogen dioxide, although the amounts were considerably lower than those of sulphur dioxide, with the minimum and maximum levels being around 25 and 35 micrograms per cubic metre respectively.
In contrast, Sydney had the lowest pollution levels with the minimum and maximum levels of sulphur dioxide being around 5 and 15 micrograms per cubic metre respectively. The levels of nitrogen dioxide were even lower, with the minimum and maximum levels being approximately 3 and 8 micrograms per cubic metre respectively. The other two cities, London and New York, had intermediate levels of both pollutants.


