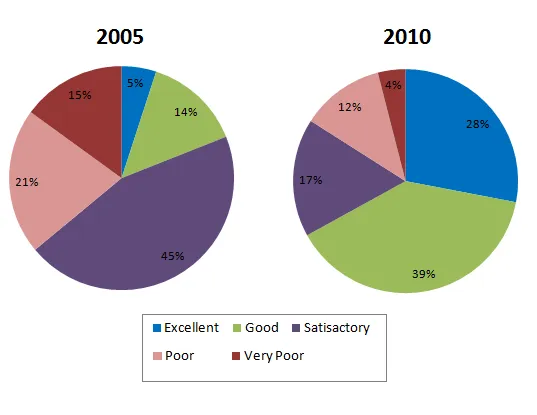
The two pie charts illustrate the feedback given by guests at the Parkway Hotel regarding the quality of customer service in 2005 and 2010.
A broad examination of the charts reveals a noticeable shift in customer perceptions over the five-year period. While a majority of guests rated the service as satisfactory in 2005, by 2010, the hotel had managed to improve its service to the extent that most guests deemed it good.
In 2005, the largest proportion of guests, 40%, found the service to be satisfactory, followed by 28% who rated it as good. Conversely, a significant 32% thought the service was poor. However, the situation had drastically improved by 2010, with 58% of guests rating the service as good, a substantial increase from 2005. The percentage of guests who found the service satisfactory had dropped to 30%, while only 12% considered it poor.
In conclusion, the Parkway Hotel made significant strides in improving its customer service between 2005 and 2010, as evidenced by the increase in guests rating the service as good and the decrease in those who found it poor or merely satisfactory.


