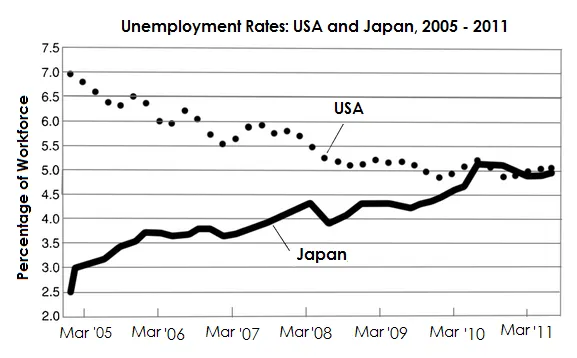
The line graph compares the percentage of people without jobs in the USA and Japan over a six-year period from March 2005 to March 2011.
Overall, it is clear that the unemployment rate in the USA was higher than that of Japan throughout the period. Furthermore, while the USA experienced a significant increase in unemployment, Japan saw a slight fluctuation in its unemployment rate.
In March 2005, the USA had an unemployment rate of approximately 5%, which rose steadily to reach around 10% by March 2010. Despite a small decrease, the rate remained high at just under 10% in March 2011. Meanwhile, in Japan, the unemployment rate started at just over 4% in March 2005, peaked at about 5.5% in 2009, and then fell to around 4.5% in 2011.
In conclusion, while both countries experienced increases in unemployment rates during this period, the rise was far more dramatic in the USA than in Japan. Furthermore, by 2011, Japan had managed to reduce its unemployment rate, whereas the USA's rate remained high.


