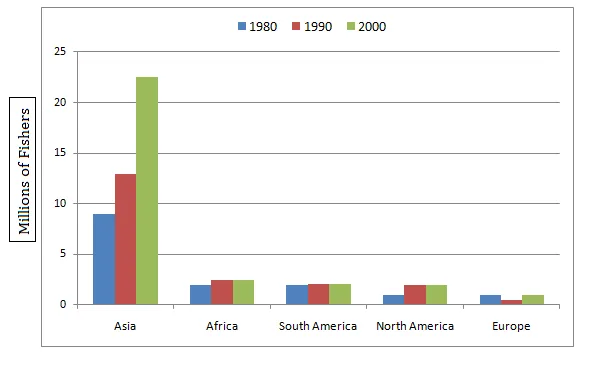
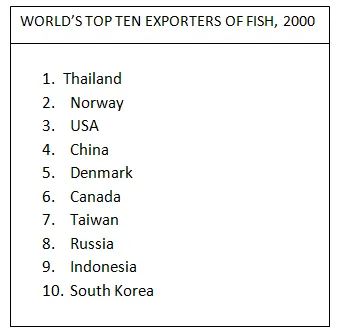
The provided graph and table illustrate the quantity of fishers in various global regions during the years 1980, 1990, and 2000, and the leading exporters of fish in the year 2000 respectively.
It can be observed from the graph that the number of fishers increased in all regions over the period, with Asia experiencing the most significant growth. The table reveals that China was the most dominant fish exporter in 2000.
In detail, Asia's fisher population rose from just over 10 million in 1980 to nearly 30 million in 2000, while Africa and Latin America saw more modest increases. Africa's fishers grew from 1.5 million to slightly over 2 million, and Latin America's from under 1 million to just above this figure. Europe, on the other hand, experienced a slight decrease in the number of fishers over the same period.
Regarding fish exports, China was by far the largest exporter in 2000, exporting over 10 million tonnes. This was more than double the amount exported by the second and third largest exporters, Norway and the USA, who exported 4.5 and 3.5 million tonnes respectively.


