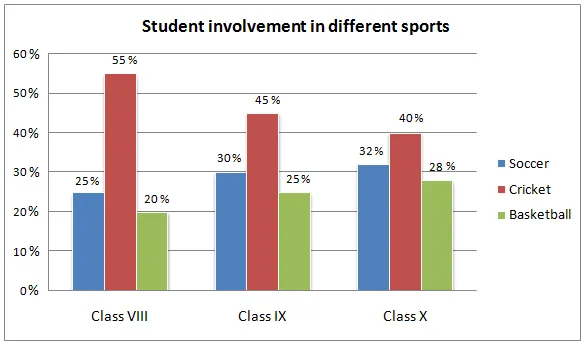
The provided graph illustrates the participation of students from different grades in three distinct sports in a particular school.
Overall, it can be observed that football is the most popular sport among students of all grades, while the least preferred is basketball. Furthermore, the participation in all sports tends to decrease as students progress to higher grades.
In the detail, the graph reveals that football has the highest participation in all grades, with over 70% of grade 1 students participating, which gradually decreases to just over 50% by grade 5. Basketball, on the other hand, starts with a participation rate of just under 20% in grade 1, and this figure drops to a mere 5% by grade 5.
Lastly, the graph shows an interesting trend in volleyball. The participation rate starts at approximately 30% in grade 1, slightly increases to 35% in grade 2, and then gradually decreases to 20% by grade 5. This suggests that volleyball maintains a relatively steady popularity among students as they progress through school.


