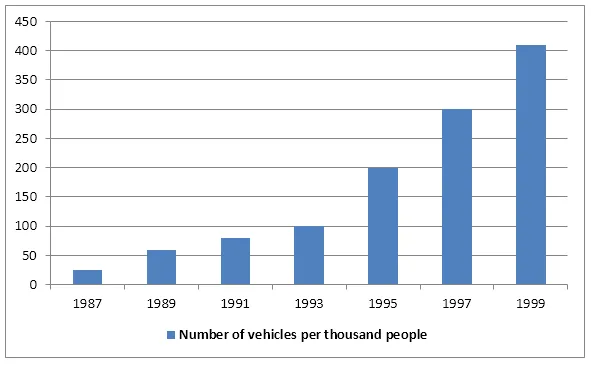
The line graph illustrates the quantity of vehicles owned per thousand individuals in China over a twelve-year period from 1987 to 1999.
It is clear from the graph that there was a significant increase in the number of vehicles owned per thousand people in China during the period under review. The trend was generally upward, albeit with some minor fluctuations.
In 1987, the number of vehicles owned per thousand people was relatively low, standing at around 10. However, this figure rose gradually over the next five years, reaching approximately 40 by 1992. Despite a slight dip in 1993, the upward trend continued, with the number of vehicles per thousand people reaching just over 60 in 1996.
From 1996 onwards, the rate of increase accelerated dramatically. By 1998, the number of vehicles per thousand people had almost doubled, reaching a peak of around 120. Despite a slight decrease in 1999, the final year of the period, the number remained significantly higher than the 1987 figure.


